Use the figure below to answer the following question(s) .
Figure 10-10 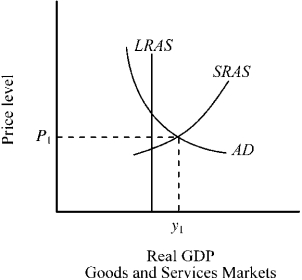
-Given the aggregate demand and aggregate supply conditions depicted in Figure 10-10, which of the following will tend to occur?
A) an increase in resource prices, which will shift SRAS to the left
B) a decrease in resource prices, which will shift SRAS to the left
C) an increase in the real rate of interest, which will shift aggregate demand to the left
D) a decrease in the real rate of interest, which will shift aggregate demand to the left
E) Both b and c are correct.
Correct Answer:
Verified
Q72: The economic boom between 2002 and 2006
Q138: Use the figure below to answer the
Q139: Use the figure below to answer the
Q141: Use the figure below to answer the
Q142: Use the figure below to answer the
Q144: Use the figure below to answer the
Q145: Use the figure below to answer the
Q146: Use the figure below to answer the
Q147: Use the figure below to answer the
Q148: Figure 10-13 ![]()
Unlock this Answer For Free Now!
View this answer and more for free by performing one of the following actions

Scan the QR code to install the App and get 2 free unlocks

Unlock quizzes for free by uploading documents