Use the figure below to answer the following question(s) .
Figure 10-6 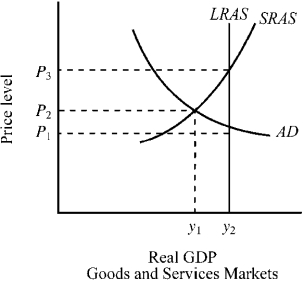
-Given the aggregate demand and aggregate supply curves for the economy depicted in Figure 10-6, the economy's current output and price level are
A) output y1 and price level P2.
B) output y2 and price level P1.
C) output y1 and price level P3.
D) output y2 and price level P3.
Correct Answer:
Verified
Q72: The economic boom between 2002 and 2006
Q139: Use the figure below to answer the
Q141: Use the figure below to answer the
Q142: Use the figure below to answer the
Q143: Use the figure below to answer the
Q145: Use the figure below to answer the
Q146: Use the figure below to answer the
Q147: Use the figure below to answer the
Q148: Figure 10-13 Q149: Use the figure below to answer the![]()
Unlock this Answer For Free Now!
View this answer and more for free by performing one of the following actions

Scan the QR code to install the App and get 2 free unlocks

Unlock quizzes for free by uploading documents