The figure below illustrates the cost and revenue structure for a monopoly firm.
Figure 11-17
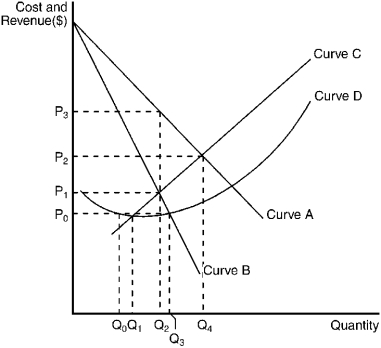
-Refer to Figure 11-17.The marginal revenue curve for a monopoly firm is depicted by curve
A) A.
B) B.
C) C.
D) D.
Correct Answer:
Verified
Q82: Figure 11-16 Q86: Figure 11-18 Q89: Use the figure to answer the following Q91: Figure 11-18 Q99: Use the figure to answer the following Q185: The figure below illustrates the cost and Q186: The figure below illustrates the cost and Q187: The figure below illustrates the cost and Q189: Figure 11-14 Q192: The figure below illustrates the cost and Unlock this Answer For Free Now! View this answer and more for free by performing one of the following actions Scan the QR code to install the App and get 2 free unlocks Unlock quizzes for free by uploading documents![]()
![]()
![]()
![]()

