The figure below illustrates the cost and revenue structure for a monopoly firm.
Figure 11-17
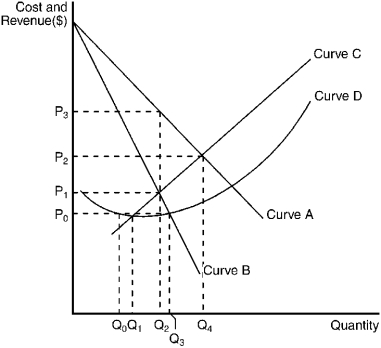
-Refer to Figure 11-17.If the monopoly firm is currently producing Q₃ units of output,then a decrease in output will necessarily cause profit to
A) remain unchanged.
B) decrease.
C) increase as long as the new level of output is at least Q₂.
D) increase as long as the new level of output is at least Q₁.
Correct Answer:
Verified
Q82: Figure 11-16 Q86: Figure 11-18 Q89: Use the figure to answer the following Q90: Figure 11-18 Q99: Use the figure to answer the following Q185: The figure below illustrates the cost and Q186: The figure below illustrates the cost and Q188: The figure below illustrates the cost and Q189: Figure 11-14 Q192: The figure below illustrates the cost and Unlock this Answer For Free Now! View this answer and more for free by performing one of the following actions Scan the QR code to install the App and get 2 free unlocks Unlock quizzes for free by uploading documents![]()
![]()
![]()
![]()

