Which graph in Figure 2-2 represents a constant non-zero velocity?
Figure 2-2
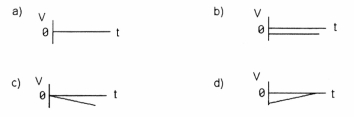
A) graph a
B) graph b
C) graph c
D) graph d
E) both graphs c and d
Correct Answer:
Verified
Q27: The slope of a line connecting two
Q28: The slope of a tangent line at
Q29: A new car manufacturer advertises that their
Q30: Suppose that an object travels from one
Q31: Which graph in Figure 2-1 represents an
Q33: If an object is accelerating, it must
Q34: Which graph(s) in Figure 2-3 represent(s) zero
Q35: Which graph in Figure 2-4 represents constant
Q36: For constant linear acceleration, the position versus
Q37: For constant linear acceleration, the velocity versus
Unlock this Answer For Free Now!
View this answer and more for free by performing one of the following actions

Scan the QR code to install the App and get 2 free unlocks

Unlock quizzes for free by uploading documents