Which graph in Figure 2-4 represents constant positive acceleration?
Figure 2-4
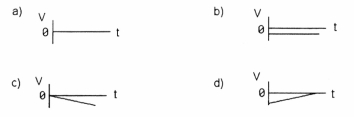
A) graph a
B) graph b
C) graph c
D) graph d
E) both graphs c and d
Correct Answer:
Verified
Q30: Suppose that an object travels from one
Q31: Which graph in Figure 2-1 represents an
Q32: Which graph in Figure 2-2 represents a
Q33: If an object is accelerating, it must
Q34: Which graph(s) in Figure 2-3 represent(s) zero
Q36: For constant linear acceleration, the position versus
Q37: For constant linear acceleration, the velocity versus
Q38: Suppose that an object is moving with
Q39: Can an object's velocity change direction when
Q40: Which of the following can never be
Unlock this Answer For Free Now!
View this answer and more for free by performing one of the following actions

Scan the QR code to install the App and get 2 free unlocks

Unlock quizzes for free by uploading documents