Multiple Choice
figure shows the speedometer readings as a car comes to a stop. Solve graphically for the acceleration at .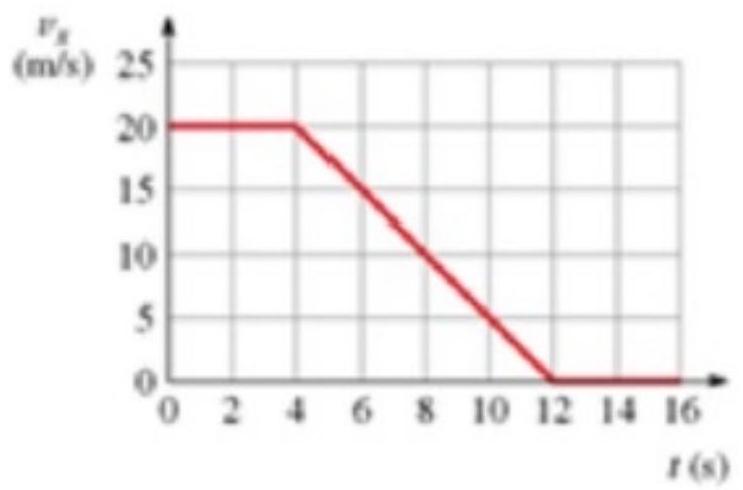
A)
B)
C)
D)
Correct Answer:
Verified
Related Questions
Unlock this Answer For Free Now!
View this answer and more for free by performing one of the following actions

Scan the QR code to install the App and get 2 free unlocks

Unlock quizzes for free by uploading documents