The following figure depicts the production possibilities curve when Ann and Bob engage in trade. With all her resources, Ann can either produce two computer programs or one Web site. With all his resources, Bob can either produce one computer program or three Web sites.
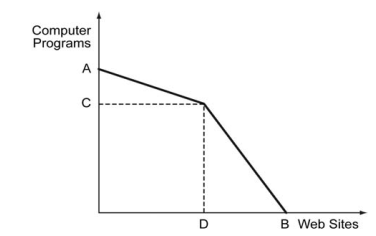
-Refer to the figure above. What is the value of A?
A) 1
B) 2
C) 3
D) 4
Correct Answer:
Verified
Q1: Yasmin and Zeek are lawyers working at
Q2: Yasmin and Zeek are lawyers working at
Q4: The following figure depicts the production possibilities
Q5: The following figure depicts the production possibilities
Q6: The figure below shows production possibilities curves
Q7: The figure below shows production possibilities curves
Q8: Suppose an economy produces only solar panels
Q9: The U.S. wheat market is represented by
Q10: The following figure shows the demand curve,
Q11: The following figure shows the demand curve,
Unlock this Answer For Free Now!
View this answer and more for free by performing one of the following actions

Scan the QR code to install the App and get 2 free unlocks

Unlock quizzes for free by uploading documents