The figure below shows production possibilities curves for tomatoes and oranges in two prefectures in a country.
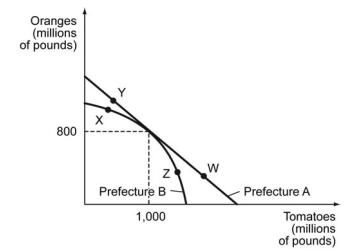
-Refer to the figure above. Suppose that Prefecture A produces at point Y, while Prefecture B produces at point Z. Could there be gains from trade (Prefecture A sells oranges to Prefecture B, and Prefecture B sells tomatoes to Prefecture B) ? Why or why not?
A) Yes, because Prefecture A has a comparative advantage in orange production up to 800 million pounds while Prefecture B has a comparative advantage in tomato production beyond 1 billion pounds.
B) Yes, because Prefecture A produces more oranges while Prefecture B produces more tomatoes.
C) No, because Prefecture A's opportunity cost of producing additional pound of tomatoes at W is higher than Prefecture B's opportunity cost at X.
D) No, because Prefecture A's opportunity cost of producing additional pound of oranges at W is higher than Prefecture B's opportunity cost at X.
Correct Answer:
Verified
Q2: Yasmin and Zeek are lawyers working at
Q3: The following figure depicts the production possibilities
Q4: The following figure depicts the production possibilities
Q5: The following figure depicts the production possibilities
Q6: The figure below shows production possibilities curves
Q8: Suppose an economy produces only solar panels
Q9: The U.S. wheat market is represented by
Q10: The following figure shows the demand curve,
Q11: The following figure shows the demand curve,
Q12: The following quote describes Chinaʹs effect on
Unlock this Answer For Free Now!
View this answer and more for free by performing one of the following actions

Scan the QR code to install the App and get 2 free unlocks

Unlock quizzes for free by uploading documents