Multiple Choice
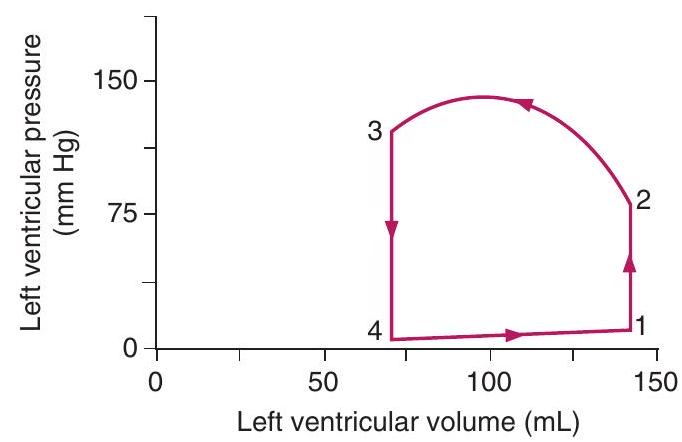
-On the graph showing left ventricular volume and pressure, isovolumetric contraction occurs between points
A)
B)
C)
D)
Correct Answer:
Verified
Related Questions
-On the graph showing left ventricular volume and pressure, isovolumetric contraction occurs between points
A)
B)
C)
D)
Correct Answer:
Verified

