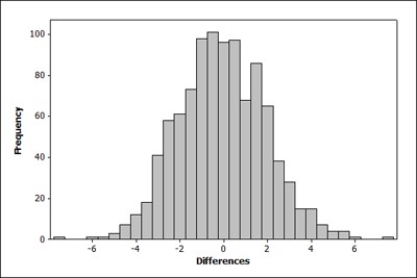
The following figure shows a randomization distribution for the hypotheses  versus
  The statistic used for each sample is
  Which of the two possible sample results provides the most evidence against
  ?
?
A)  = 56.5;
  = 51.3
B)  = 50.2;
  = 53.1
Correct Answer:
Verified
Q2: The average SAT-Critical Reading score for college
Q3: A statistical test uses data from a
Q4: Identify the error in the following hypotheses:
Q5: Identify the error in the following hypotheses:
Q6: Identify the error in the following hypotheses:
Q7: Which of the following samples provides the
Q8: Use the following to answer the questions
Q9: Of the two p-values, which provides more
Q10: Q11: ![]()
![]()
Unlock this Answer For Free Now!
View this answer and more for free by performing one of the following actions

Scan the QR code to install the App and get 2 free unlocks

Unlock quizzes for free by uploading documents