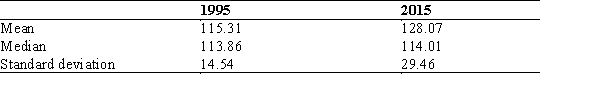
Below is a summary of data about violent crime rates (number of violent crimes per 100,000 population) for a sample of 20 cities in two different years. Describe this statistical information in words. What changes occurred in the overall shape of the distribution for this variable? In central tendency? In dispersion?
Correct Answer:
Verified
View Answer
Unlock this answer now
Get Access to more Verified Answers free of charge
Q48: Table 3.1 Data Set of Six Volunteers
Q49: Table 3.1 Data Set of Six Volunteers
Q50: Table 3.1 Data Set of Six Volunteers
Q51: Table 3.2 Park Space in Five Neighbourhoods
Q52: Table 3.2 Park Space in Five Neighbourhoods
Q53: Table 3.3 Means and Standard Deviations in
Q54: Table 3.3 Means and Standard Deviations in
Q55: Describe what a boxplot portrays and explain
Q56: What is the difference between central tendency
Q57: The mayor of a city (City A)
Unlock this Answer For Free Now!
View this answer and more for free by performing one of the following actions

Scan the QR code to install the App and get 2 free unlocks

Unlock quizzes for free by uploading documents