The following graph shows 2 isocost curves for a firm. The price of capital is $200.
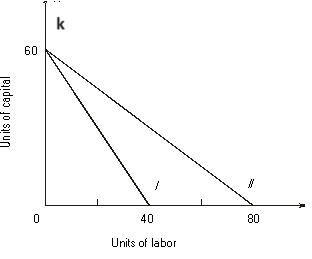
-The equation for isocost II is _____________________. With isocost II the firm must give up ______ units of capital to purchase one more unit of labor in the market.
Correct Answer:
Verified
Q11: refer to the following: Q12: refer to the following: Q13: The following graph shows 2 isocost curves Q14: The following graph shows 2 isocost curves Q15: The following graph shows 2 isocost curves Q17: In the following figure, isoquant I is Q18: In the following figure, isoquant I is Q19: In the following figure, isoquant I is Q20: Use the following figure that shows a Q21: Use the following figure that shows a
![]()
![]()
Unlock this Answer For Free Now!
View this answer and more for free by performing one of the following actions

Scan the QR code to install the App and get 2 free unlocks

Unlock quizzes for free by uploading documents