In the following figure, isoquant I is one of a firm's isoquants:
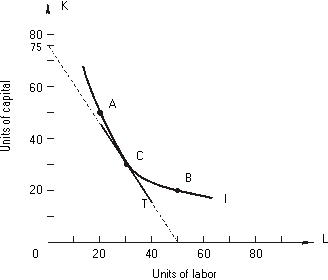
-The marginal rate of technical substitution between points C and B is _________.
Correct Answer:
Verified
Q13: The following graph shows 2 isocost curves
Q14: The following graph shows 2 isocost curves
Q15: The following graph shows 2 isocost curves
Q16: The following graph shows 2 isocost curves
Q17: In the following figure, isoquant I is
Q19: In the following figure, isoquant I is
Q20: Use the following figure that shows a
Q21: Use the following figure that shows a
Q22: Use the following figure that shows a
Q23: Use the following figure that shows a
Unlock this Answer For Free Now!
View this answer and more for free by performing one of the following actions

Scan the QR code to install the App and get 2 free unlocks

Unlock quizzes for free by uploading documents