Use the following figure that shows a firm's isoquant for producing 3,000 units of output and four isocost curves. Labor and capital each cost $100 per unit. 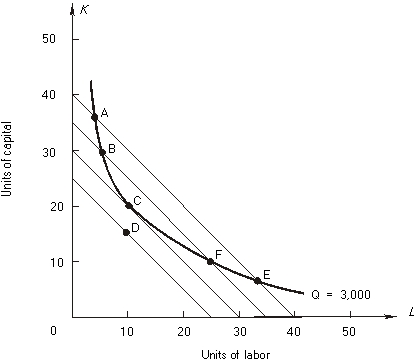
-At point C the firm __________________ the cost of producing 3,000 units of output. The MRTS is _______________ (greater than, less than, equal to) the input price ratio, w/r.
Correct Answer:
Verified
Q17: In the following figure, isoquant I is
Q18: In the following figure, isoquant I is
Q19: In the following figure, isoquant I is
Q20: Use the following figure that shows a
Q21: Use the following figure that shows a
Q23: Use the following figure that shows a
Q24: Answer the following:
-At point E, the MP
Q25: Answer the following:
-The movement from E to
Q26: Answer the following:
-At input combination C the
Q27: Answer the following:
-Input combination D costs $_.
Unlock this Answer For Free Now!
View this answer and more for free by performing one of the following actions

Scan the QR code to install the App and get 2 free unlocks

Unlock quizzes for free by uploading documents