The scatterplot below shows student heights (y axis) versus father's heights (x axis) for a sample of 173 college students. The symbol "+" represents a male student and the symbol "o" is represents a female student.
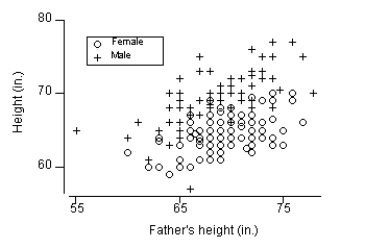 Based on the scatterplot, what is the problem with using a regression equation for all 173 students?
Correct Answer:
Verified
View Answer
Unlock this answer now
Get Access to more Verified Answers free of charge
Q89: What is the effect of an outlier
Q90: A scatter plot of number of teachers
Q91: Use the following information for questions:
Consider
Q92: Use the following information for questions:
Consider
Q93: A professor found a negative correlation between
Q94: Suppose a study of employees at a
Q95: A survey of students found a negative
Q96: A researcher found a positive correlation between
Q98: What are influential observations and where are
Q99: The 25 item "Parenting Hassles Scale" asks
Unlock this Answer For Free Now!
View this answer and more for free by performing one of the following actions

Scan the QR code to install the App and get 2 free unlocks

Unlock quizzes for free by uploading documents