The 25 item "Parenting Hassles Scale" asks parents questions about certain situations in their family. They are asked to rate these situations on (1) how often they occur (frequency), and (2) how much they bother them (intensity). The score system for the frequency was 0-4 points (0 = never, 4 = all the time) and for the intensity 1-5 (1 = not much at all, 5 = very much). If an item received a 0 (zero) for frequency, it automatically received a 0 (zero) for intensity. The two variables, frequency and intensity, were formed by taking the total of the corresponding scores from the two rating scales across the various situations These two variables are then used to create a scatterplot. The symbols indicate whether a mother, a father, or a step parent filled in the questionnaire.
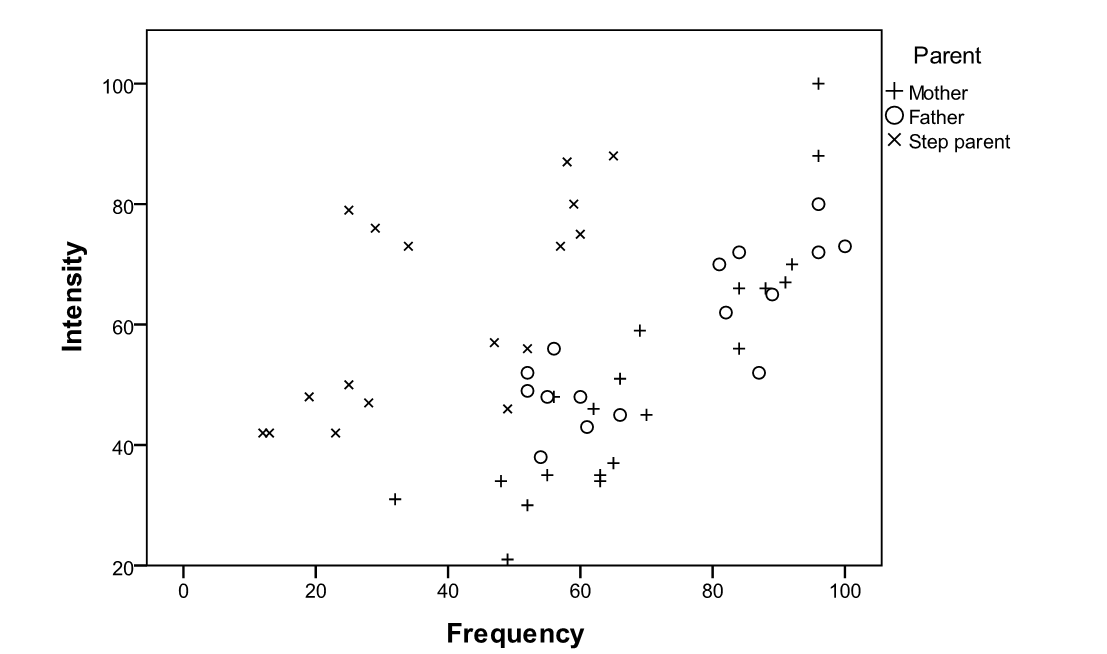 Based on the scatterplot, what is the problem with using one regression equation for all parents combined?
Correct Answer:
Verified
View Answer
Unlock this answer now
Get Access to more Verified Answers free of charge
Q89: What is the effect of an outlier
Q90: A scatter plot of number of teachers
Q91: Use the following information for questions:
Consider
Q92: Use the following information for questions:
Consider
Q93: A professor found a negative correlation between
Q94: Suppose a study of employees at a
Q95: A survey of students found a negative
Q96: A researcher found a positive correlation between
Q97: The scatterplot below shows student heights (y
Q98: What are influential observations and where are
Unlock this Answer For Free Now!
View this answer and more for free by performing one of the following actions

Scan the QR code to install the App and get 2 free unlocks

Unlock quizzes for free by uploading documents