Drawn below are two dotplots displaying the number of letters that could be written in 15 seconds among 63 students using their dominant hand and then using their non-dominant hand. Also given are the 5 number summaries. Describe any differences or similarities between the two sets of data. 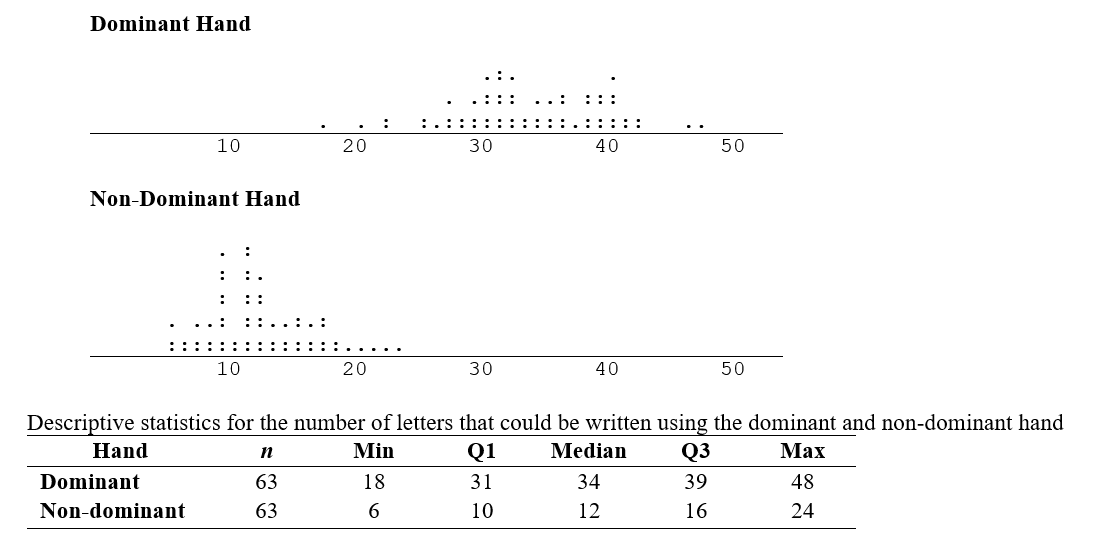
Correct Answer:
Verified
View Answer
Unlock this answer now
Get Access to more Verified Answers free of charge
Q48: Use the following information for questions:
The
Q49: Use the following information for questions:
The
Q50: In the Sydney 2000 Olympics, Cathy
Q51: In the Sydney 2000 Olympics, Michael
Q52: Drawn below are two dotplots displaying the
Q54: Drawn below are two dotplots displaying the
Q55: Drawn below are two dotplots displaying the
Q56: Drawn below are two dotplots displaying the
Q57: Use the following information for questions:
The
Q58: Use the following information for questions:
The
Unlock this Answer For Free Now!
View this answer and more for free by performing one of the following actions

Scan the QR code to install the App and get 2 free unlocks

Unlock quizzes for free by uploading documents