Drawn below are two dotplots displaying the number of minutes spent exercising during a typical week for 36 female and 39 male students at Penn State University. Also given are the five number summaries. Describe any differences or similarities between the two sets of data. 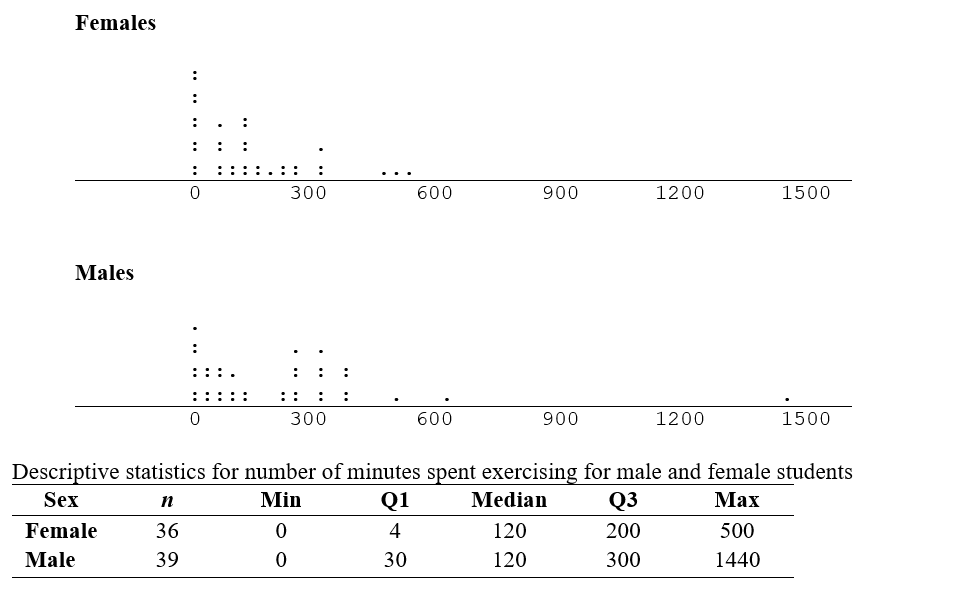
Correct Answer:
Verified
View Answer
Unlock this answer now
Get Access to more Verified Answers free of charge
Q50: In the Sydney 2000 Olympics, Cathy
Q51: In the Sydney 2000 Olympics, Michael
Q52: Drawn below are two dotplots displaying the
Q53: Drawn below are two dotplots displaying the
Q54: Drawn below are two dotplots displaying the
Q56: Drawn below are two dotplots displaying the
Q57: Use the following information for questions:
The
Q58: Use the following information for questions:
The
Q59: Use the following information for questions:
The
Q60: In a National Cancer Institute study of
Unlock this Answer For Free Now!
View this answer and more for free by performing one of the following actions

Scan the QR code to install the App and get 2 free unlocks

Unlock quizzes for free by uploading documents