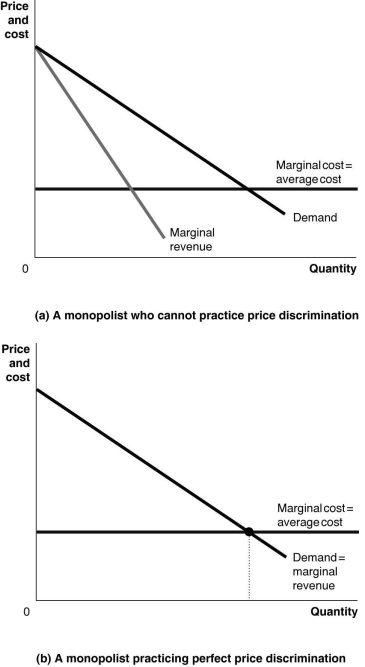
-Refer to Figure 15-18. Graph (a) represents a monopolist who cannot price discriminate and graph (b) represents a monopolist practicing perfect price discrimination. On each graph, identify the monopoly price, the monopoly output, the efficient output, and the areas representing profit, consumer surplus, and deadweight loss.
Correct Answer:
Verified
View Answer
Unlock this answer now
Get Access to more Verified Answers free of charge
Q34: Q35: Q36: Q37: Q38: Delaware and North Dakota have identical state Q40: Which of the following is not one Q41: Alphabet, the parent company of Google, announced Q42: Alphabet, the parent company of Google, announced Q43: Q44: Unlock this Answer For Free Now! View this answer and more for free by performing one of the following actions Scan the QR code to install the App and get 2 free unlocks Unlock quizzes for free by uploading documents![]()
![]()
![]()
![]()
![]()
![]()

