Multiple Choice
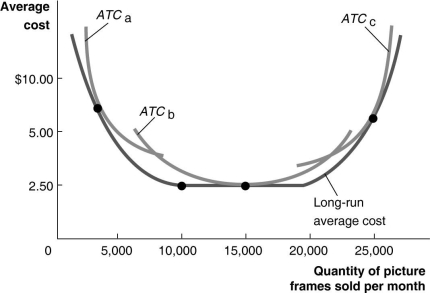
Figure 11-10 illustrates the long-run average cost curve for a firm that produces picture frames. The graph also includes short-run average cost curves for three firm sizes: ATCa, ATCb and ATCc.
-Refer to Figure 11-10. The minimum efficient scale of output is reached at what rate of output?
A) 10,000 workers
B) 5,000 picture frames
C) 20,000 picture frames
D) 10,000 picture frames
Correct Answer:
Verified
Related Questions

