Multiple Choice
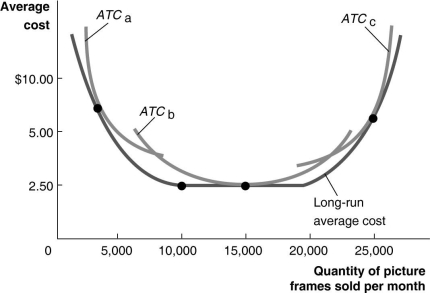
Figure 11-10 illustrates the long-run average cost curve for a firm that produces picture frames. The graph also includes short-run average cost curves for three firm sizes: ATCa, ATCb and ATCc.
-Refer to Figure 11-10. Constant returns to scale
A) occur for output rates greater than 5,000 picture frames.
B) occur between 5,000 and 20,000 picture frames per month.
C) occur between 10,000 and 20,000 pictures frames per month.
D) will shift the long-run average cost curve downward.
Correct Answer:
Verified
Related Questions

