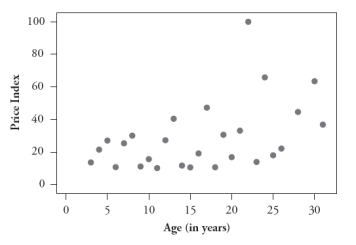
The following four scatterplots pertain to a study that investigated predicting the price of a wine based on its age and three variables associated with the weather during the year in which it was produced: summer temperature, winter rain, and harvest rain:
A:
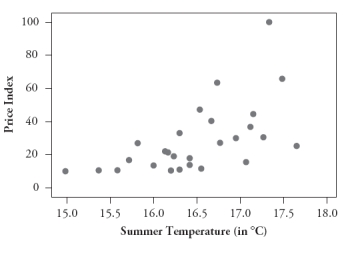
 B:
B:
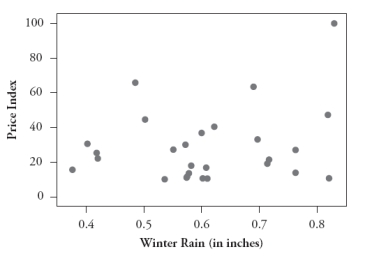
 C:
C:
 D:
D:
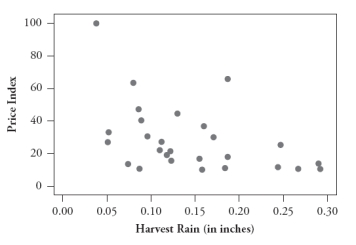 Consider the following five correlation values. Four of them are calculated from these scatterplots, and the fifth does not apply to any of these graphs. For each correlation value, you are either to identify the graph that it is calculated from or say that it does not apply to any of these graphs.
1. -.750
2. -.449
3. .234
4. .452
5. .589
Correct Answer:
Verified
Q1: The following scatterplots display the price vs.
Q2: The following scatterplot displays lung capacity (forced
Q4: In a large statistics class, students have
Q5: The following scatterplot displays the rushing yardage
Q6: The following scatterplot displays the rushing yardage
Q7: The following scatterplot displays the rushing yardage
Q8: The following scatterplot displays the rushing yardage
Q9: The following scatterplot displays the rushing yardage
Q10: The following data are the age (in
Q11: The following data are the age (in
Unlock this Answer For Free Now!
View this answer and more for free by performing one of the following actions

Scan the QR code to install the App and get 2 free unlocks

Unlock quizzes for free by uploading documents