The following scatterplots display the price vs. age for a sample of Hanoverian-bred dressage horses listed for sale on the Internet. The graph on the left displays these data for female horses, the graph on the right for male horses: 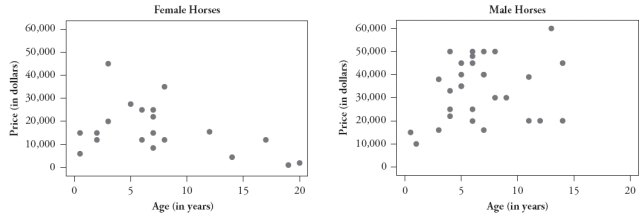
1. Is the oldest horse in this sample male or female?
2. Is the most expensive horse in this sample male or female?
3. Which horse would you predict to cost more: a 10-year-old male horse or a 10-year-old female horse?
4. Which gender has a positive association between price and age?
5. Which gender has the stronger association between price and age?
Correct Answer:
Verified
Q2: The following scatterplot displays lung capacity (forced
Q3: The following four scatterplots pertain to a
Q4: In a large statistics class, students have
Q5: The following scatterplot displays the rushing yardage
Q6: The following scatterplot displays the rushing yardage
Q7: The following scatterplot displays the rushing yardage
Q8: The following scatterplot displays the rushing yardage
Q9: The following scatterplot displays the rushing yardage
Q10: The following data are the age (in
Q11: The following data are the age (in
Unlock this Answer For Free Now!
View this answer and more for free by performing one of the following actions

Scan the QR code to install the App and get 2 free unlocks

Unlock quizzes for free by uploading documents