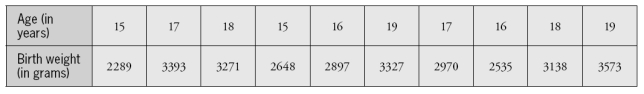
The following data are the age (in years) and baby's birth weight (in grams) for a sample of 10 young women who gave birth as teenagers:
 Consider the following summary statistics:
Mean age: 17.0 years
SD ages: 1.49 years
Mean birth weight: 3004 grams
SD birth weights: 414 grams
Correlation coefficient between age and birth weight: .884
-What percentage of variability in baby weights is explained by the linear relationship with mother's age?
Correct Answer:
Verified
View Answer
Unlock this answer now
Get Access to more Verified Answers free of charge
Q8: The following scatterplot displays the rushing yardage
Q9: The following scatterplot displays the rushing yardage
Q10: The following data are the age (in
Q11: The following data are the age (in
Q12: The following data are the age (in
Q14: A sample of students at a university
Q15: A sample of students at a university
Q16: A sample of students at a university
Q17: A sample of students at a
Q18: A sample of students at a university
Unlock this Answer For Free Now!
View this answer and more for free by performing one of the following actions

Scan the QR code to install the App and get 2 free unlocks

Unlock quizzes for free by uploading documents