Scientists have studied whether one can predict temperature based on the frequency of a cricket's chirps. Consider the following two scatterplots based on data gathered in one study of 30 crickets, with temperature measured in degrees Fahrenheit and chirp frequency measured in chirps per minute:
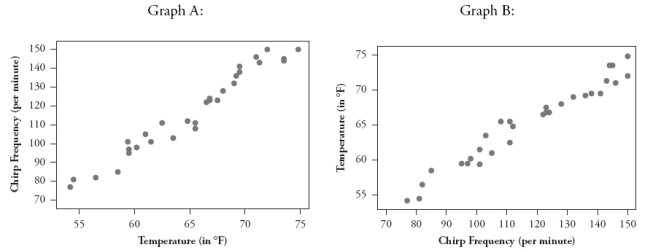 a. If the goal is to predict temperature based on a cricket's chirps per minute, which is the appropriate scatterplot to examine, A or B? Explain briefly.
Consider the following computer output:
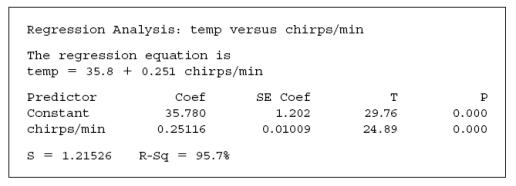 b. Determine the value of the correlation coefficient between temperature and chirp frequency.
c. What temperature would the regression model predict if the cricket were chirping at 110 chirps per minute? Is this prediction an example of extrapolation? Explain briefly.
d. Identify the value of the test statistic for testing whether the population slope coefficient is zero.
e. Produce and interpret a 90% confidence interval for the population slope coefficient.
Correct Answer:
Verified
View Answer
Unlock this answer now
Get Access to more Verified Answers free of charge
Q19: A statistician found data in an advertisement
Q20: A statistician found data in an advertisement
Q21: A statistician found data in an advertisement
Q22: A statistician found data in an advertisement
Q23: A statistician found data in an advertisement
Q25: Suppose for each student in a statistics
Q26: The following scatterplots display the age (in
Q27: The following scatterplot displays the number of
Q28: Think of an example, not discussed in
Q29: Suppose you record data on these four
Unlock this Answer For Free Now!
View this answer and more for free by performing one of the following actions

Scan the QR code to install the App and get 2 free unlocks

Unlock quizzes for free by uploading documents