For the homeowner's utility data studied in the previous question, the following regression output pertains to natural gas usage and mean temperature:
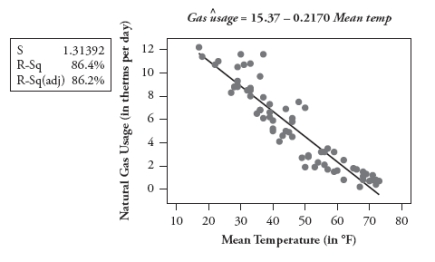 a. Report and interpret the value of the slope coefficient in context.
b. Use the least squares line to predict the gas usage per day in a month with a mean temperature of 50 degrees.
c. Determine the value of the correlation coefficient.
d. What proportion of the variability in gas usage is explained by the least squares line with mean monthly temperature?
e. Does the r2 value reveal what percentage of the data values fall on the least squares line?(Answer yes or no, but you need not bother to explain.)
Correct Answer:
Verified
View Answer
Unlock this answer now
Get Access to more Verified Answers free of charge
Q25: Suppose for each student in a statistics
Q26: The following scatterplots display the age (in
Q27: The following scatterplot displays the number of
Q28: Think of an example, not discussed in
Q29: Suppose you record data on these four
Q30: a. Suppose everyone in your class scores
Q31: It can be shown that the sum
Q32: Every month for a period of many
Q34: Naturalists recorded the following data on size
Q35: In a recent study of the effectiveness
Unlock this Answer For Free Now!
View this answer and more for free by performing one of the following actions

Scan the QR code to install the App and get 2 free unlocks

Unlock quizzes for free by uploading documents