
Figure 9.4
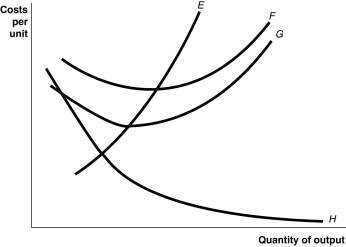
-Refer to Figure 9.4.Identify the curves in the diagram.
A) E = average fixed cost curve; F = variable cost curve; G = total cost curve, H = marginal cost curve
B) E = marginal cost curve; F = total cost curve; G = variable cost curve, H = average fixed cost curve
C) E = average fixed cost curve; F = average total cost curve; G = average variable cost curve, H = marginal cost curve
D) E = marginal cost curve; F = average total cost curve; G = average variable cost curve; H = average fixed cost curve
Correct Answer:
Verified
Q110: Table 9.3 Q118: Figure 9.4 Q202: Suppose the total cost of producing 40,000 Q205: Explain how the listed events (a-d)would affect Q207: As output increases, average fixed cost gets Q212: If production displays economies of scale, the Q217: If, when a firm doubles all its Q218: As the level of output increases, what Q219: Over the past twenty years, the number Q234: The long-run average cost curve shows
![]()
A)the lowest
Unlock this Answer For Free Now!
View this answer and more for free by performing one of the following actions

Scan the QR code to install the App and get 2 free unlocks

Unlock quizzes for free by uploading documents