
Figure 9.4
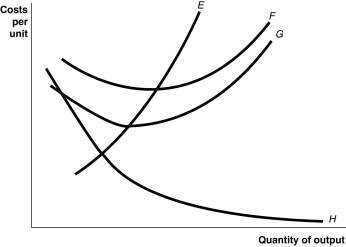
-Refer to Figure 9.4.The vertical difference between curves F and G measures
A) average fixed costs.
B) marginal costs.
C) fixed costs.
D) sunk costs.
Correct Answer:
Verified
Q79: If the average variable cost curve is
Q114: Figure 9.4 Q123: Figure 9.5 Q131: In 1955,the chairman of the Sony corporation Q202: Suppose the total cost of producing 40,000 Q207: As output increases, average fixed cost gets Q212: If production displays economies of scale, the Q218: As the level of output increases, what Q234: The long-run average cost curve shows Q237: When a firm's long-run average cost curve
![]()
![]()
A)the lowest
Unlock this Answer For Free Now!
View this answer and more for free by performing one of the following actions

Scan the QR code to install the App and get 2 free unlocks

Unlock quizzes for free by uploading documents