
Figure 10.4
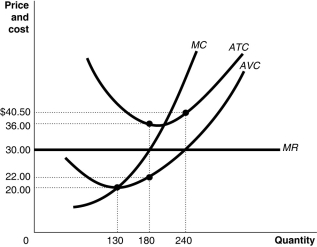
Figure 10.4 shows the cost and demand curves for a profit-maximizing firm in a perfectly competitive market.
-Refer to Figure 10.4.If the market price is $30 and the firm is producing output, what is the amount of the firm's profit or loss?
A) loss of $1,080
B) profit of $1,440
C) loss of $2,520
D) profit of $1,300
Correct Answer:
Verified
Q41: Figure 10.3 Q42: Figure 10.4 Q50: Figure 10.4 Q62: Assume that price is greater than average Q68: In a graph with output on the Q82: Assume that price is greater than average Q84: How are market price, average revenue, and Q96: An increase in a firm's fixed cost Q114: If a perfectly competitive firm's price is Q115: If a perfectly competitive firm's price is Unlock this Answer For Free Now! View this answer and more for free by performing one of the following actions Scan the QR code to install the App and get 2 free unlocks Unlock quizzes for free by uploading documents
![]()
![]()
![]()

