Multiple Choice
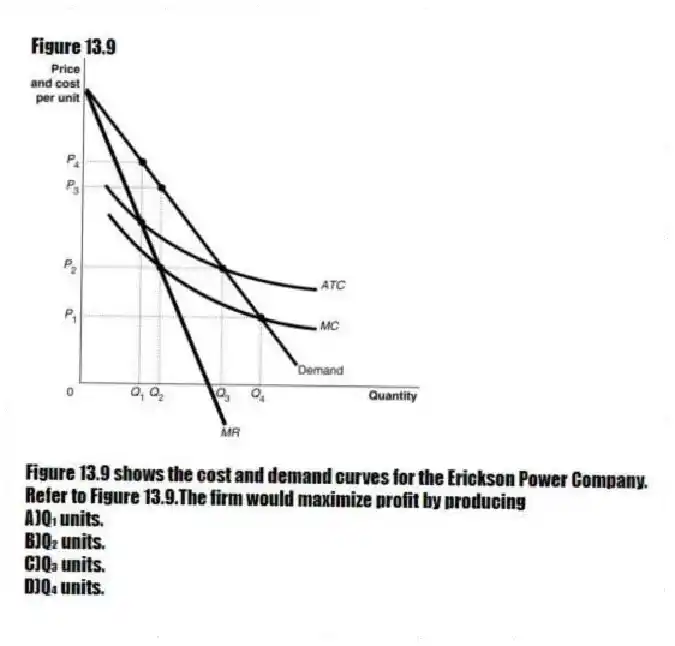
Figure 13.9
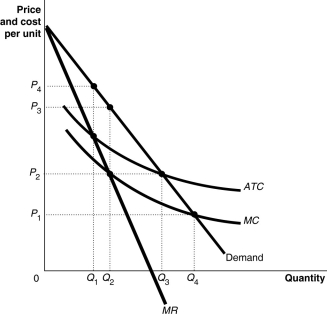
Figure 13.9 shows the cost and demand curves for the Erickson Power Company.
-Refer to Figure 13.9.The firm would maximize profit by producing
A) Q₁ units.
B) Q₂ units.
C) Q₃ units.
D) Q₄ units.
Correct Answer:
Verified
Related Questions
Q134: Figure 13.9 Q135: Figure 13.9 Q137: Figure 13.7 Q138: Figure 13.9 Q140: A merger between two competitors may be Q142: Competition Bureau would never approve a proposed Q143: Why would some firms collude in violation Unlock this Answer For Free Now! View this answer and more for free by performing one of the following actions Scan the QR code to install the App and get 2 free unlocks Unlock quizzes for free by uploading documents
![]()
![]()
![]()
![]()

