Multiple Choice
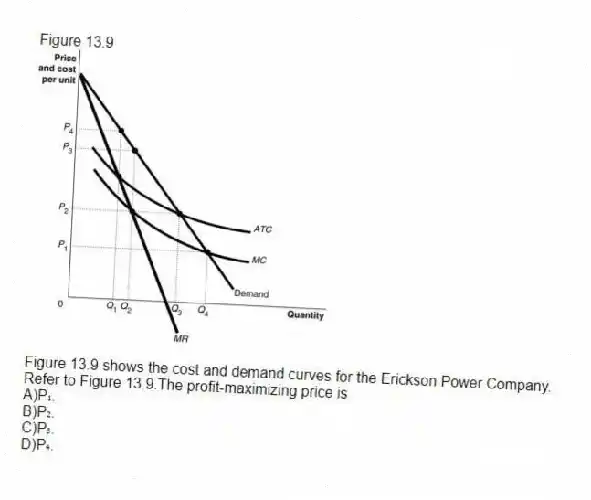
Figure 13.9
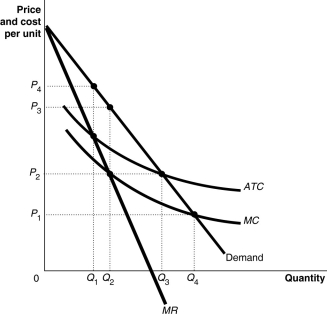
Figure 13.9 shows the cost and demand curves for the Erickson Power Company.
-Refer to Figure 13.9.The profit-maximizing price is
A) P₁.
B) P₂.
C) P₃.
D) P₄.
Correct Answer:
Verified
Related Questions
Figure 13.9
Figure 13.9 shows the cost and demand curves for the Erickson Power Company.
-Refer to Figure 13.9.The profit-maximizing price is
A) P₁.
B) P₂.
C) P₃.
D) P₄.
Correct Answer:
Verified

