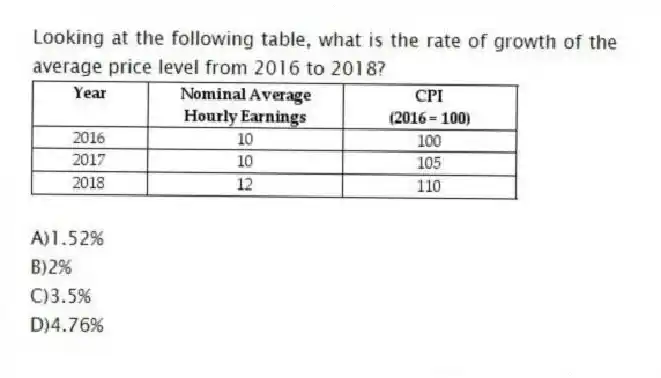
Looking at the following table, what is the rate of growth of the average price level from 2016 to 2018?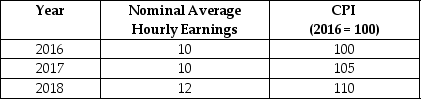
A) 1.52%
B) 2%
C) 3.5%
D) 4.76%
Correct Answer:
Verified
Q51: Looking at the following table, what is
Q52: If the nominal rate of interest is
Q53: Inflation that is _ than what is
Q54: Looking at the following table, what is
Q55: If the anticipated rate of inflation is
Q57: If you want to earn a real
Q58: Looking at the following table, real average
Q59: If the nominal interest rate is 8%
Q60: Using the following table, calculate real average
Q242: What is the difference between the nominal
Unlock this Answer For Free Now!
View this answer and more for free by performing one of the following actions

Scan the QR code to install the App and get 2 free unlocks

Unlock quizzes for free by uploading documents