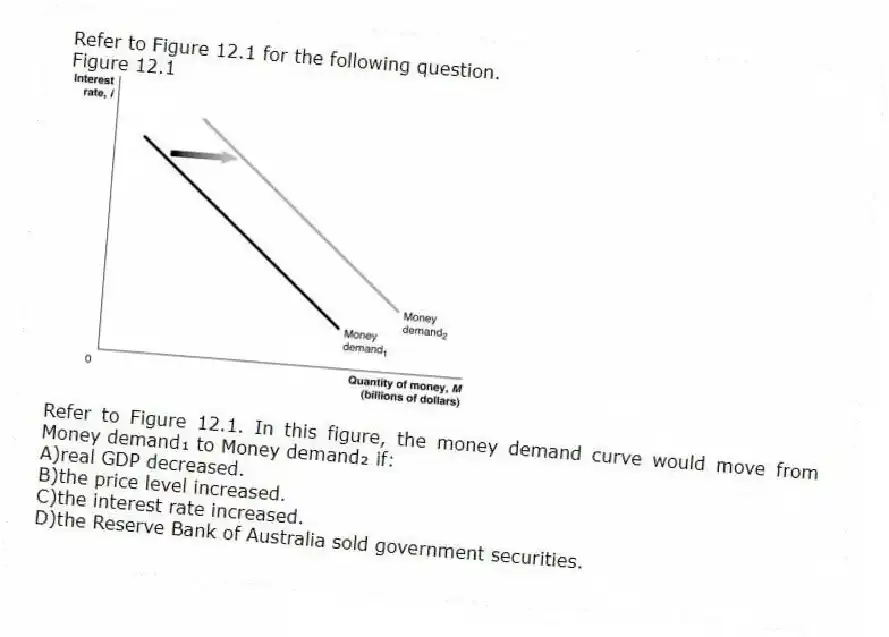
Refer to Figure 12.1 for the following question.
Figure 12.1
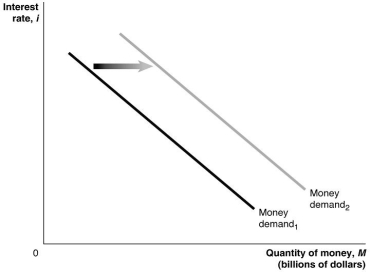
-Refer to Figure 12.1. In this figure, the money demand curve would move from Money demand₁ to Money demand₂ if:
A) real GDP decreased.
B) the price level increased.
C) the interest rate increased.
D) the Reserve Bank of Australia sold government securities.
Correct Answer:
Verified
Q16: Give an example of a monetary policy
Q17: What is 'inflation targeting'?
_
_
Q18: Rising prices erode the value of money
Q19: The policy aimed at managing interest rates
Q20: The money demand curve has a:
A)negative slope.
B)positive
Q22: Accounts held with the Reserve Bank of
Q23: The overnight cash rate is determined:
A)administratively by
Q24: Refer to Figure 12.2 for the following
Q25: 'Monetary policy' targets the:
A)long-term real rate of
Q26: The 'cash rate' is the interest rate:
A)the
Unlock this Answer For Free Now!
View this answer and more for free by performing one of the following actions

Scan the QR code to install the App and get 2 free unlocks

Unlock quizzes for free by uploading documents