
Refer to Figure 12.2 for the following question.
Figure 12.2
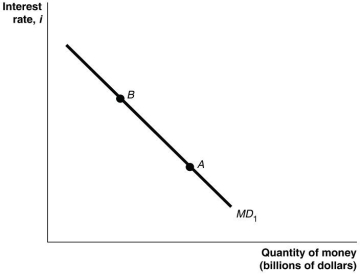
-Refer to Figure 12.2. In this figure, a movement from point A to point B would be caused by:
A) a decrease in real GDP.
B) an increase in the price level.
C) a decrease in the price level.
D) an increase in the interest rate.
Correct Answer:
Verified
Q19: The policy aimed at managing interest rates
Q20: The money demand curve has a:
A)negative slope.
B)positive
Q21: Refer to Figure 12.1 for the following
Q22: Accounts held with the Reserve Bank of
Q23: The overnight cash rate is determined:
A)administratively by
Q25: 'Monetary policy' targets the:
A)long-term real rate of
Q26: The 'cash rate' is the interest rate:
A)the
Q27: Open market operations occur when the Reserve
Q28: If real GDP decreases:
A)the money demand curve
Q29: Which of the following correctly describes what
Unlock this Answer For Free Now!
View this answer and more for free by performing one of the following actions

Scan the QR code to install the App and get 2 free unlocks

Unlock quizzes for free by uploading documents