
Figure 5-11
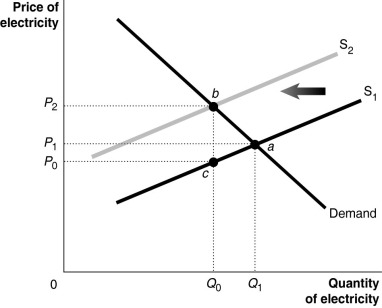
Coal burning utilities release sulfur dioxide and nitric acid which react with water to produce acid rain. Acid rain damages trees and crops and kills fish. Because the utilities do not bear the cost of the acid rain, they overproduce the quantity of electricity. This is illustrated in Figure 5-11.
-Refer to Figure 5-11.S₁ represents the supply curve that reflects the marginal private cost of production and S₂ represents the supply curve that reflects the marginal social cost of production.One way to internalize the external cost generated by utilities is to impose a Pigovian tax on the production of electricity.What is the size of the Pigovian tax that will internalize the cost of the externality?
A) P₀
B) P₂-P₀
C) P₁-P₀
D) P₂-P₁
Correct Answer:
Verified
Q167: Figure 5-13 Q168: Figure 5-13 Q169: Figure 5-13 Q170: Figure 5-13 Q171: Which of the following is an example Q173: Assume that production from an electric utility Q174: Economists generally favor the use of tradable Q175: State and local governments subsidize college students Q176: Figure 5-13 Q177: Figure 5-13 Unlock this Answer For Free Now! View this answer and more for free by performing one of the following actions Scan the QR code to install the App and get 2 free unlocks Unlock quizzes for free by uploading documents
![]()
![]()
![]()
![]()
![]()
![]()

