
Figure 12-5
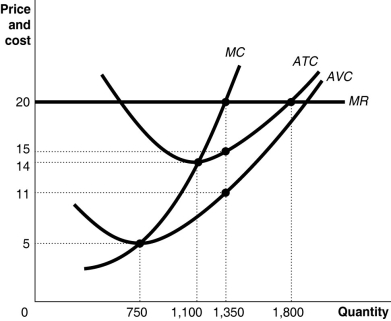
Figure 12-5 shows cost and demand curves facing a typical firm in a constant-cost, perfectly competitive industry.
-Refer to Figure 12-5.The firm's manager suggests that the firm's goal should be to maximize average profit.In that case, what is the output level and what is the average profit that will achieve the manager's goal?
A) Q = 1,350 units, average profit = $5
B) Q = 1,100 units, average profit = $6
C) Q = 1,350 units, average profit = $9
D) Q = 1,800 units, average profit = $20
Correct Answer:
Verified
Q115: If a perfectly competitive firm's price is
Q116: Figure 12-5 Q117: Figure 12-4 Q118: Article Summary Q119: Figure 12-4 Q121: A firm will make a profit when Q122: A firm will break even when Unlock this Answer For Free Now! View this answer and more for free by performing one of the following actions Scan the QR code to install the App and get 2 free unlocks Unlock quizzes for free by uploading documents
![]()
![]()
According to the Department of Agriculture,
![]()
A)P
A)P =

