Multiple Choice

Figure 12-5
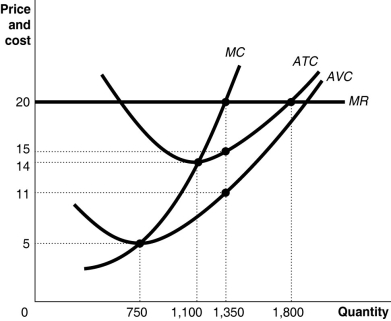
Figure 12-5 shows cost and demand curves facing a typical firm in a constant-cost, perfectly competitive industry.
-Refer to Figure 12-5.What is the amount of the firm's fixed cost of production?
A) $5,400
B) $6,750
C) $8,100
D) It cannot be determined.
Correct Answer:
Verified
Related Questions

