Multiple Choice

Figure 12-5
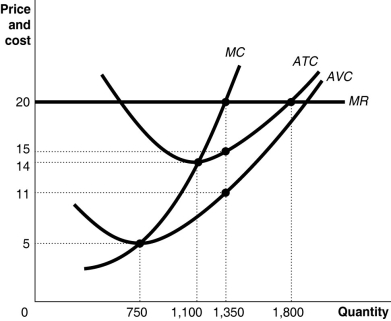
Figure 12-5 shows cost and demand curves facing a typical firm in a constant-cost, perfectly competitive industry.
-Refer to Figure 12-5.If the firm's fixed cost increases by $1,000 due to a new environmental regulation, what happens in the diagram above?
A) All the cost curves shift upward.
B) Only the average variable cost and average total cost curves shift upward; marginal cost is not affected.
C) Only the average total cost curve shifts upward; the marginal cost and average variable cost curves are not affected.
D) None of the curves shifts; only the fixed cost curve, which is not shown here, is affected.
Correct Answer:
Verified
Related Questions

