
Figure 12-5
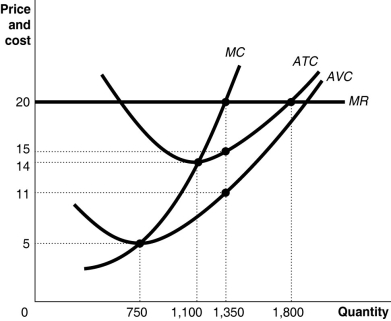
Figure 12-5 shows cost and demand curves facing a typical firm in a constant-cost, perfectly competitive industry.
-Refer to Figure 12-5.The figure shows the cost structure of a firm in a perfectly competitive market.If the firm's fixed cost increases by $1,000 due to a new environmental regulation, what happens to its profit-maximizing output level?
A) It increases.
B) It decreases.
C) It remains the same.
D) It could increase, decrease, or remain constant, depending on whether the firm is able to cut costs somewhere else.
Correct Answer:
Verified
Q97: If a perfectly competitive apple farm's marginal
Q98: If, for the last bushel of apples
Q99: What is the relationship among the following
Q100: Fill in the columns in the following
Q101: A perfectly competitive firm earns a profit
Q103: All of the following can be used
Q104: Figure 12-5 Q105: Figure 12-5 Q106: Figure 12-5 Q107: Article Summary Unlock this Answer For Free Now! View this answer and more for free by performing one of the following actions Scan the QR code to install the App and get 2 free unlocks Unlock quizzes for free by uploading documents
![]()
![]()
![]()
According to the Department of Agriculture,

