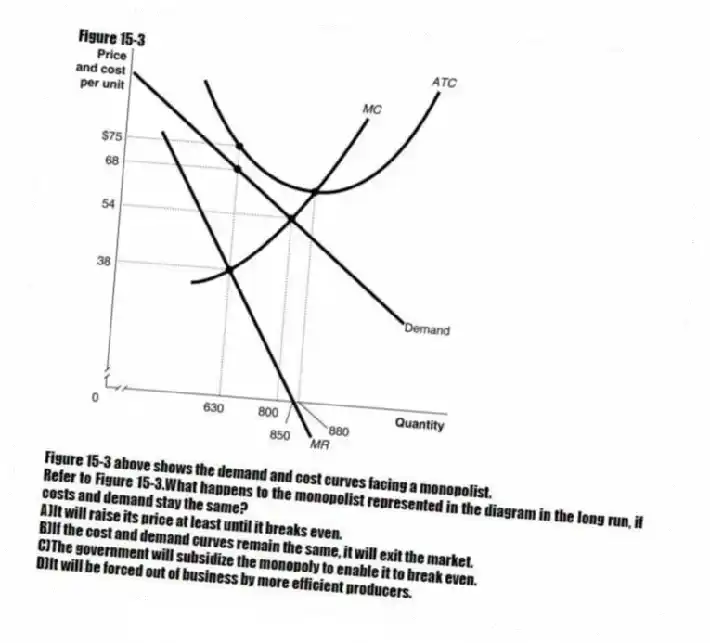
Figure 15-3

Figure 15-3 above shows the demand and cost curves facing a monopolist.
-Refer to Figure 15-3.What happens to the monopolist represented in the diagram in the long run, if costs and demand stay the same?
A) It will raise its price at least until it breaks even.
B) If the cost and demand curves remain the same, it will exit the market.
C) The government will subsidize the monopoly to enable it to break even.
D) It will be forced out of business by more efficient producers.
Correct Answer:
Verified
Q100: Figure 15-2 Q101: Figure 15-4 Q102: Long-run economic profits would most likely exist Q103: Table 15-1 Q104: Figure 15-4 Q106: Table 15-1 Q107: If a firm's average total cost is Q108: Which of the following is true for Q109: Figure 15-4 Q110: Which of the following statements applies to Unlock this Answer For Free Now! View this answer and more for free by performing one of the following actions Scan the QR code to install the App and get 2 free unlocks Unlock quizzes for free by uploading documents
![]()
![]()
![]()
![]()
![]()
![]()

