Multiple Choice
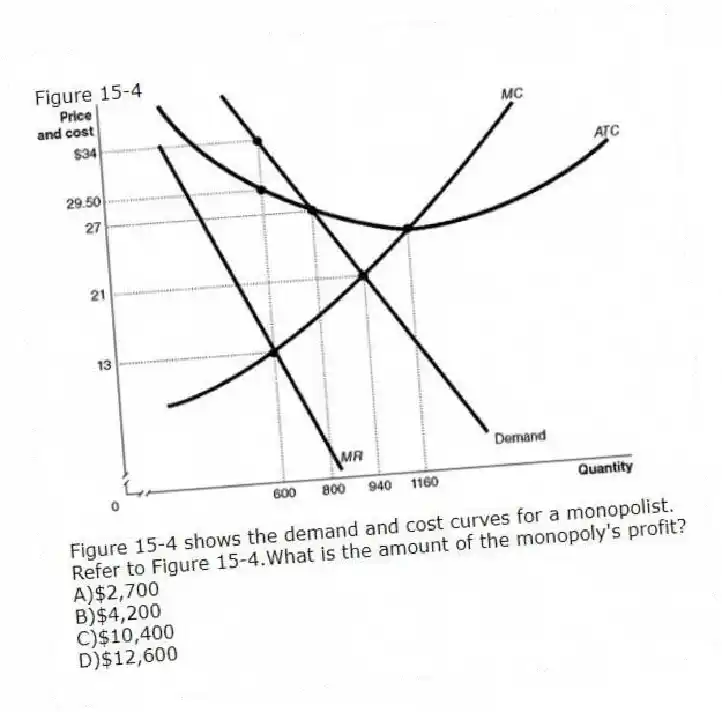
Figure 15-4
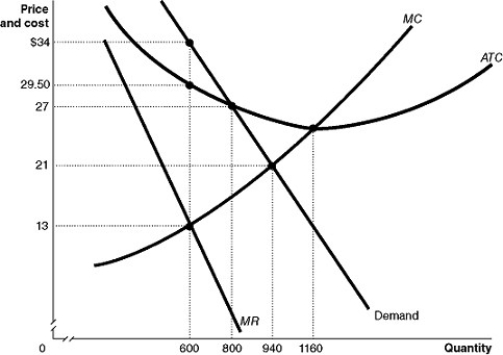
Figure 15-4 shows the demand and cost curves for a monopolist.
-Refer to Figure 15-4.What is the amount of the monopoly's profit?
A) $2,700
B) $4,200
C) $10,400
D) $12,600
Correct Answer:
Verified
Related Questions
Figure 15-4
Figure 15-4 shows the demand and cost curves for a monopolist.
-Refer to Figure 15-4.What is the amount of the monopoly's profit?
A) $2,700
B) $4,200
C) $10,400
D) $12,600
Correct Answer:
Verified

