Multiple Choice
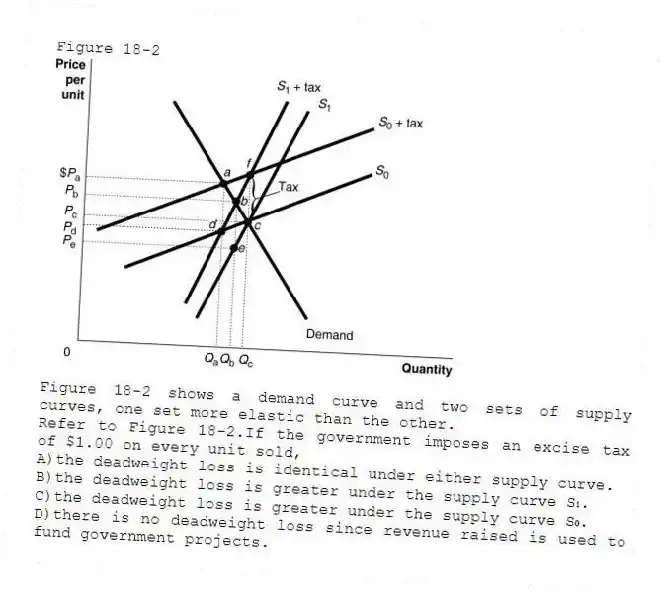
Figure 18-2

Figure 18-2 shows a demand curve and two sets of supply curves, one set more elastic than the other.
-Refer to Figure 18-2.If the government imposes an excise tax of $1.00 on every unit sold,
A) the deadweight loss is identical under either supply curve.
B) the deadweight loss is greater under the supply curve S₁.
C) the deadweight loss is greater under the supply curve S₀.
D) there is no deadweight loss since revenue raised is used to fund government projects.
Correct Answer:
Verified
Related Questions

