
You make a phospholipid bilayer with short,saturated hydrocarbon tails.You measure the permeability of this membrane to oxygen.You then double the length of the hydrocarbon tails,and remeasure membrane permeability.You then double the length of the hydrocarbon tails again,and make a third measurement of membrane permeability.You graph membrane permeability as a function of hydrocarbon tail length.Which of the graphs below best represents the data you expect?
A) 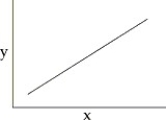
B) 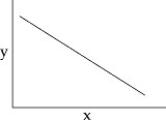
C) 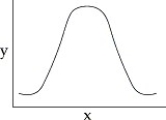
D) 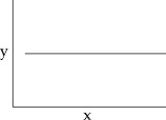
Correct Answer:
Verified
Q4: You make a phospholipid bilayer with short,saturated
Q5: How do phospholipids interact with water molecules?
A)The
Q5: Which of the following is the best
Q6: What region of a steroid is hydrophilic?
A)the
Q7: In an experiment involving planar bilayers, a
Q9: Which of the following is the best
Q10: The term phospholipid can best be described
Q11: Phospholipids can form all of the following
Q12: Which aspect of phospholipids is most important
Q14: Which of the following increases the strength
Unlock this Answer For Free Now!
View this answer and more for free by performing one of the following actions

Scan the QR code to install the App and get 2 free unlocks

Unlock quizzes for free by uploading documents