
You make a phospholipid bilayer with short,saturated hydrocarbon tails.You measure the permeability of this membrane to oxygen.You are going to change the length of the hydrocarbon tails and remeasure membrane permeability,but first your boss asks you to graph the data you expect if there is no effect of hydrocarbon tail length on membrane permeability (your null hypothesis) .Which of the graphs below best represents the data you expect if your null hypothesis is correct?
A) 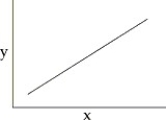
B) 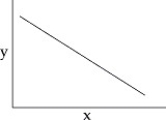
C) 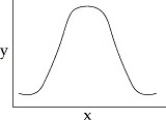
D) 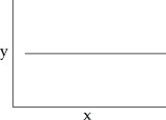
Correct Answer:
Verified
Q1: What most distinguishes lipids from other biomolecules
Q5: Which of the following is the best
Q5: How do phospholipids interact with water molecules?
A)The
Q6: What region of a steroid is hydrophilic?
A)the
Q7: You make a phospholipid bilayer with short,saturated
Q7: In an experiment involving planar bilayers, a
Q9: Which of the following is the best
Q10: The term phospholipid can best be described
Q11: Phospholipids can form all of the following
Q14: Which of the following increases the strength
Unlock this Answer For Free Now!
View this answer and more for free by performing one of the following actions

Scan the QR code to install the App and get 2 free unlocks

Unlock quizzes for free by uploading documents