
Figure 52.6 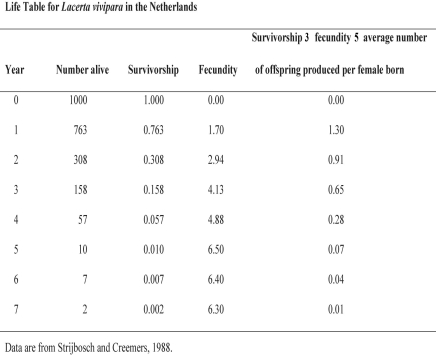
-Using Figure 52.6,determine which age class year would hurt the population growth most if it were wiped out by disease.
A) age class year 1
B) age class year 2
C) age class year 3
D) age class year 4
E) age class year 5
Correct Answer:
Verified
Q31: Figure 52.9 Q32: Which of the following statements regarding the Q33: Figure 52.9 Q34: What can we not determine from examining Q35: Figure 52.6 Q37: Figure 52.8 Q38: Figure 52.7 Q39: The regular fluctuations in size of animal Q40: If 40 individuals were alive in 1921 Q41: Figure 52.13 Unlock this Answer For Free Now! View this answer and more for free by performing one of the following actions Scan the QR code to install the App and get 2 free unlocks Unlock quizzes for free by uploading documents![]()
![]()
![]()
![]()
![]()
![]()

