
Figure 52.8 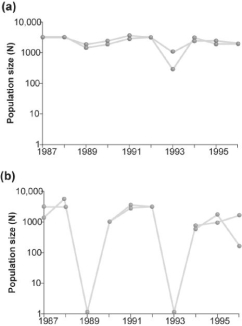
-The graph (b) in Figure 52.8 shows the normal fluctuations of a population of grouse.Assuming graph (a) in Figure 52.8 is the result of some experimental treatment in the grouse population,what can be concluded?
A) The experimental treatment exacerbated the population cycling.
B) The experimental treatment did not affect population cycling in this species.
C) The experimental treatment has most likely identified the cause of population cycling.
D) None of the above answers applies.
Correct Answer:
Verified
Q32: Which of the following statements regarding the
Q33: Figure 52.9 Q34: What can we not determine from examining Q35: Figure 52.6 Q36: Figure 52.6 Q38: Figure 52.7 Q39: The regular fluctuations in size of animal Q40: If 40 individuals were alive in 1921 Q41: Figure 52.13 Q42: Use the following abstract from Theoretical Population Unlock this Answer For Free Now! View this answer and more for free by performing one of the following actions Scan the QR code to install the App and get 2 free unlocks Unlock quizzes for free by uploading documents![]()
![]()
![]()
![]()
![]()

