
Figure 2.3
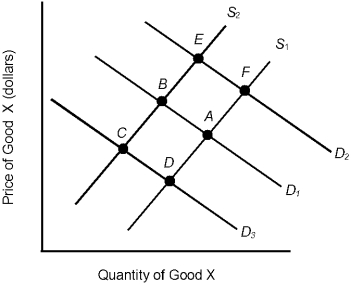
-In Figure 2.3, the initial demand curve is D1 and the supply curve is S1. Which of the following would most likely change equilibrium from point A to point D?
A) An increase in income
B) A decrease in the price of good X
C) An increase in the price of a complementary good
D) Lower productivity
E) An increase in the price of a substitute good
Correct Answer:
Verified
Q102: Figure 2.2 Q103: Q104: Figure 2.1 Q105: Figure 2.3 Q106: Q108: The difference between scarcity and shortages is Q109: Figure 2.4 Q110: If price is below equilibrium, Q111: Figure 2.2 Q112: Figure 2.1 Unlock this Answer For Free Now! View this answer and more for free by performing one of the following actions Scan the QR code to install the App and get 2 free unlocks Unlock quizzes for free by uploading documents
![]()
![]()
![]()
![]()
![]()
A)
![]()
A) demand is
![]()
![]()

