Multiple Choice

Figure 2.3
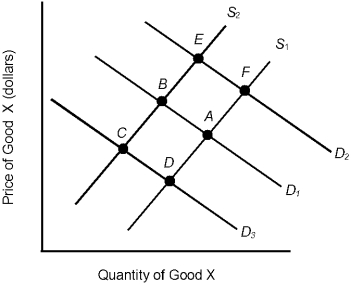
-In Figure 2.3, the initial demand curve is D1 and the supply curve is S1. If consumers become optimistic about their future economic well-being, the most likely consequence is a shift from
A) S1 to S2.
B) D1 to D2.
C) D1 to D3.
D) D3 to D1.
E) D2 to D1.
Correct Answer:
Verified
Related Questions
Q100: If a U.S. firm is purchasing supplies
Q101: Figure 2.4 Q102: Figure 2.2 Q103: Q104: Figure 2.1 Q106: Q107: Figure 2.3 Q108: The difference between scarcity and shortages is Q109: Figure 2.4 Q110: If price is below equilibrium, Unlock this Answer For Free Now! View this answer and more for free by performing one of the following actions Scan the QR code to install the App and get 2 free unlocks Unlock quizzes for free by uploading documents
![]()
![]()
![]()
![]()
![]()
![]()
A)
![]()
A) demand is

