
Figure 3.1
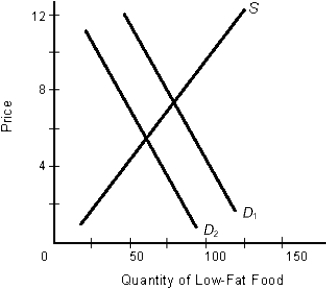
-According to Figure 3.1, as represented by the shift from D1 to D2,
A) the demand for low-fat food has risen.
B) the quantity of low-fat food supplied has declined.
C) eating low-fat food may have become popular.
D) consumer tastes for low-fat food may have risen.
E) consumer tastes for high-fat food may have fallen.
Correct Answer:
Verified
Q5: _ ensures that resources are allocated to
Q6: As the wage rate increases, the quantity
Q7: Figure 3.1 Q8: In response to an increase in demand Q9: Specialization according to comparative advantage can Q11: The process of buying identical products in Q12: Which of the following influence the level Q13: The market system is better than other Q14: A change in consumer tastes for low-carb Q15: In a market system, resources flow from
![]()
A) generate
Unlock this Answer For Free Now!
View this answer and more for free by performing one of the following actions

Scan the QR code to install the App and get 2 free unlocks

Unlock quizzes for free by uploading documents